
I recently watched an interesting video that posed the question, “If the world was reduced to a village of just 100 people - what would it look like?”
I found it a simple and effective concept for communicating how our world is made up (by taking huge numbers and shrinking them down to easily understood values for comparison purposes) and wondered what that same concept would look like for one of NationalMap’s key areas of focus - New Zealand’s road network.
The richness of this multimodal transport data in NationalMap’s Roads & Transport dataset makes it our most popular product.
It provides our customers with access to named roads, carriageways, turn restrictions, one-way indicators, speed limits, travel speed categories, surface type, legality, pedestrian and cycle networks, bridges, publicly and privately-maintained roads, railways, ferry routes, airports, points of interest, and much more.
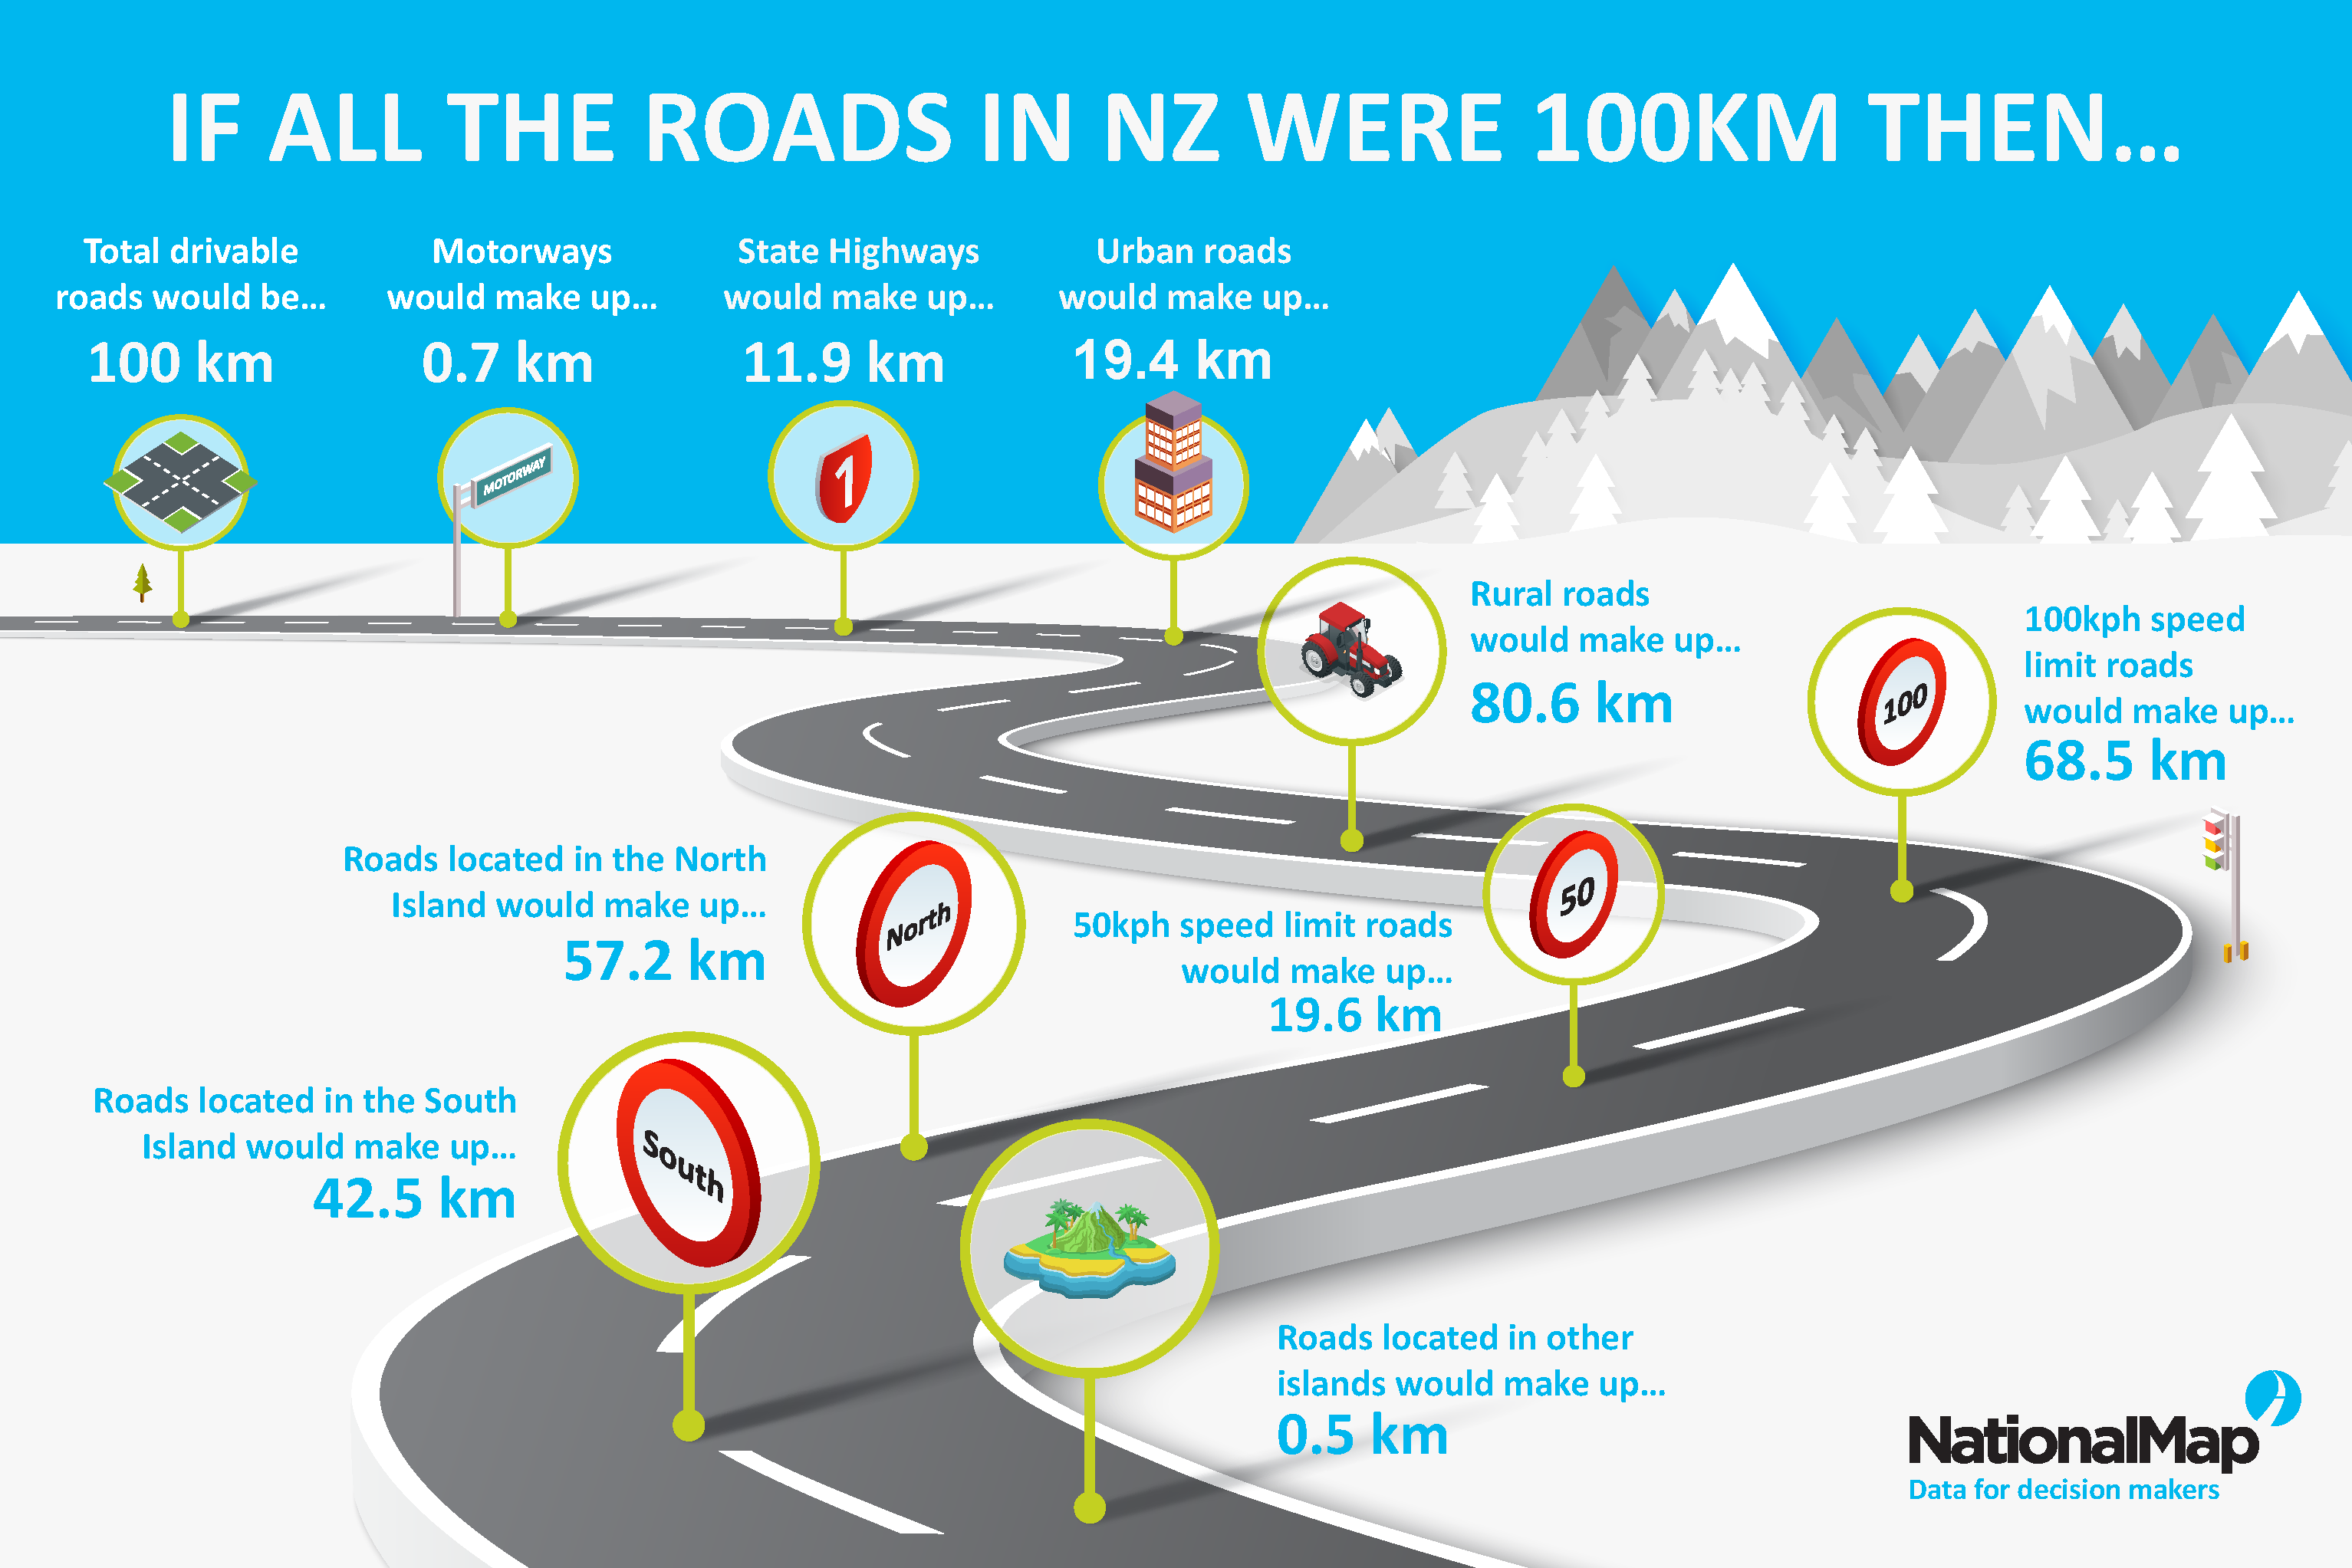
There’s well in excess of 100,000 km of drivable roads in New Zealand, so if we were to reduce all that to 100 km, what proportion of those 100 km comprise motorways, or rural roads versus urban?
There are a lot of variables - and variability - contained within our nation’s road network, so reducing that down to 100 km makes that variability much easier to visualise – and quite interesting!
So, the team at NationalMap has put together a couple of infographics inspired by the “100 people” concept.
Infographic 1
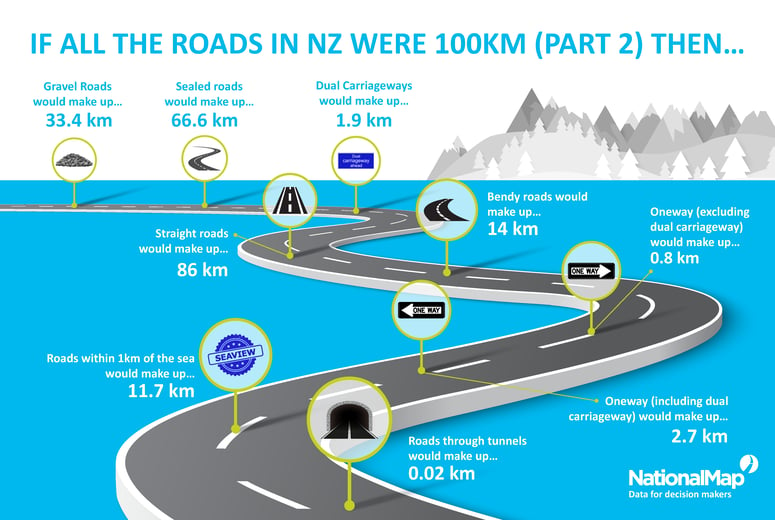
Infographic 2
It’s worth noting that the infographics and data are a current snapshot in time and part of the power of the NationalMap database is the ability to actually see, compare and understand changes through time and in different historical states.
A clear example of the value and insight that NationalMap’s historical roading data can provide is demonstrated by the increase in roads with a 50km speed limit. This has increased markedly over the last few years (most likely due to the Government’s Road to Zero and Safe Speeds strategies) and today is quite different to only a couple of years ago.
Since NationalMap is the only truly national roading and transport dataset in New Zealand, we offer the complete picture at a national level (or whatever level you need), for the variable(s) you’re interested in.
If you believe your business operations can be helped by deploying NationalMap’s Road & Transport data then get in touch with us today.