
Over the last few weeks, the NationalMap team have been working on a project for a client that is largely based around identifying the physical attributes, infrastructure and amenities of our cities and towns.
The idea being that a resident’s proximity (or lack thereof) to these features can contribute to their overall health and well-being quite considerably.
The project is using our extensive points of interest POI data sets such as hospitals, schools, supermarkets, parks & reserves, railway stations, bus stops, pharmacies and more.
A lot of interesting data and insights have emerged through the course of this project and I thought would it be worth sharing these more widely as part of a short series on the relationship between people and their proximity to amenities.
To put together this series we have used the “large and major urban areas” as defined by Statistics NZ to capture our city boundaries and extents. This gives us 19 cities across New Zealand and we will use these cities as our reference point when comparing various geographical attributes, infrastructure and amenities.
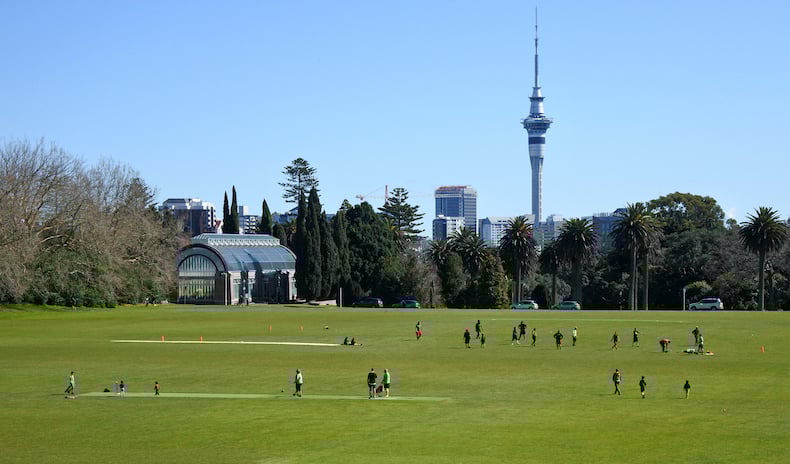
The first attribute insight that I wanted to share is certainly the most visible from a cartographic perspective and that is parks, reserves and green spaces.
And before we dive in, a quick note on the methodology of how we defined our park and reserve areas for this analysis. We used NationalMap’s Parks & Reserves dataset, which is nationally curated from official parks & reserves data advised by the Department of Conservation, regional councils, and territorial authorities.
Now, it’s probably no surprise that access to parks, reserves and green space is considered a key factor in determining quality of life and has numerous health benefits such as, improved immune systems, cognitive function and physical fitness, as well as just being closely linked with lower mortality rates in general.
Indeed the World Health Organisation has recommended that policy makers ensure that “urban residents should be able to access public green spaces of at least 0.5–1 hectare within 300 metres linear distance (around 5 minutes’ walk) of their homes.”
However, the results may surprise you (because they certainly surprised us) and there’s definitely likely to be a few pre-conceived notions challenged - sorry Christchurch.
Percentage of city area that is designated as park or reserve
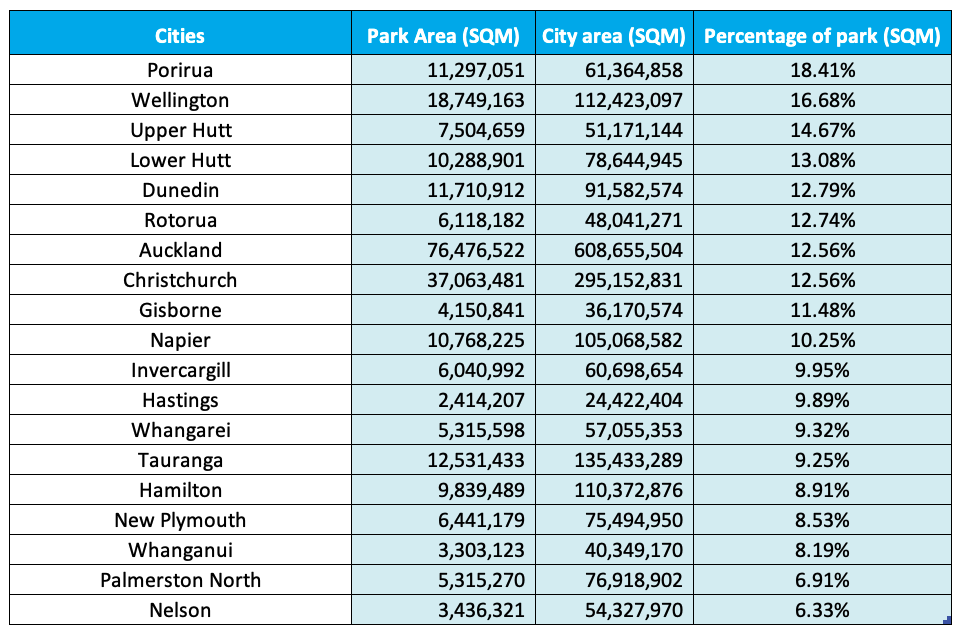
As you can see from the above table, 4 of the top 5 cities with the most park area are all in the Wellington region and the only South Island city that ranks in the top 5 for park and reserves by city area is Dunedin.
With Christchurch in the South Island routinely referred to as “the garden city”, we expected to see it rank highly when we analysed how much of the city was park area.
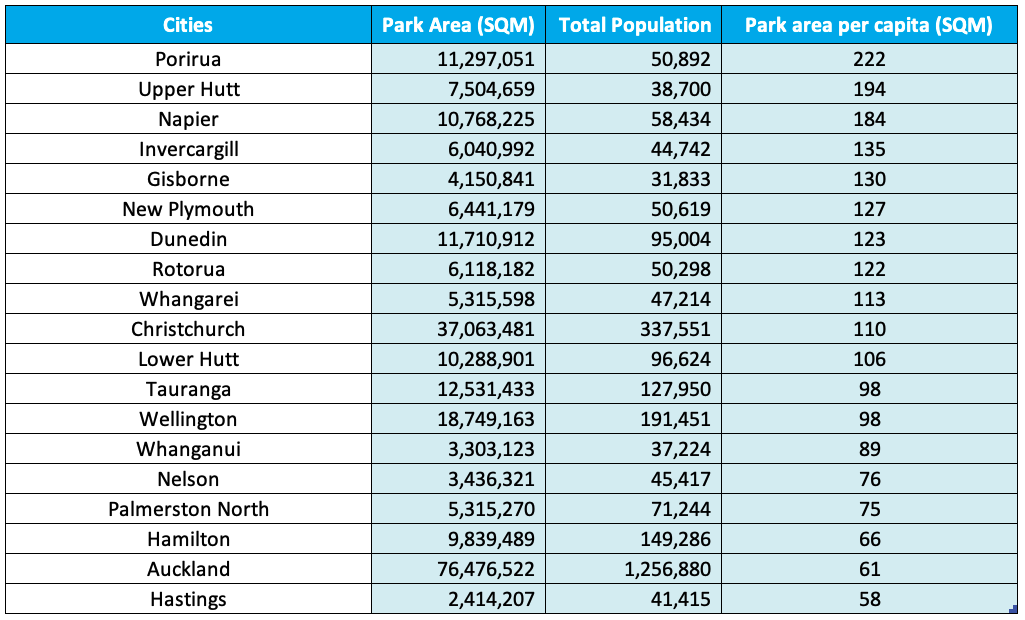
But, going on our analysis, there’s really no clear basis for Christchurch being dubbed the “garden city”. It rates only about middle out of the 19 cities for percentage of city area dedicated to parks/reserves/green space and also only ranks about mid table for the amount of parks/reserves (SQM) per capita as well (see below table).
Square metres of park area per capita
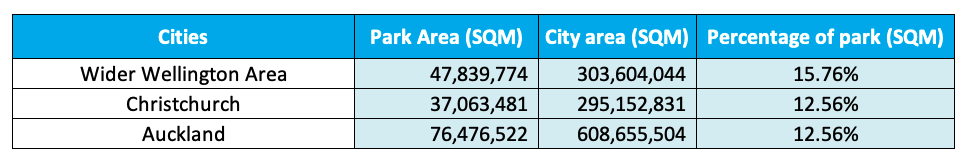
Due to the way that Statistics New Zealand define their large and major urban areas, the wider Wellington area is split out into four separate cities, Wellington (city), Upper Hutt, Lower Hutt and Porirua. The two other mains centres of Auckland and Christchurch are not treated in a similar way, so we also wanted to see a more representative comparison between the main centres which you can see in the below tables.
Main Centres comparison - Percentage of city area that is designated as park or reserve
Main Centres comparison - Square metres of park area per capita
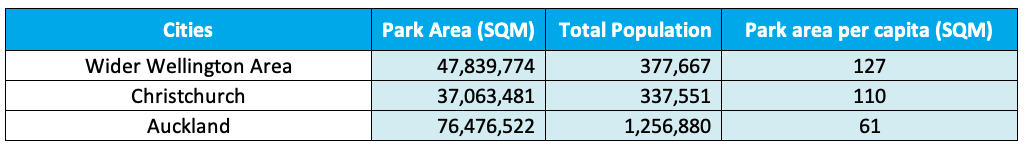
When looking at the three main centres, we can see that significantly more of the wider Wellington area is designated as park or reserve, with a lot more park area per capita than either Auckland or Christchurch as well. Auckland’s population density is also clearly demonstrated in the park area per capita measure.
Why analysing and visualising parks & reserves (and other POI data) is important
If we are to accept the WHO’s proposition that what they term “green infrastructure” (parks, reserves and green space to you and I) increases quality of life and improves health outcomes, then this data and analysis on New Zealand cities and their parks/reserves/green space should help inform city planners when planning “green infrastructure” for their own cities.
While clearly an important metric for a number of reasons, parks and reserves are just one small part of NationalMap’s Points of Interest (POI) database and can be readily viewed via the basemaps available in the NationalMap Data Service. However, as is almost always the case in geospatial science, it is the overlaying of multiple data points across geographic areas that creates the most compelling and actionable of insights.
If we think again of our city planners, being able to visualise the proximity of each dwelling or house to amenities (such as parks and reserves) this creates the kind of rich and meaningful insight that can be used to better inform planning for new developments as well as green infrastructure.
If you believe your business operations can be helped by deploying NationalMap data and solutions, then get in touch with us today.